Client
Client
Udaiti Foundation
Udaiti Foundation
Agency
Agency
Studio Manasi Doshi
Studio Manasi Doshi
The Brief
Some projects feel less like assignments and more like shared intent.
When Udaiti Foundation approached us, we knew this was one of them. As a not-for-profit focused on advancing women’s economic participation in India, their work sits at the intersection of research, policy and real-world impact.
The ask was to design a comprehensive set of scorecards and factsheets focused on data about gender equality in employment. These would capture critical data across corporate sectors in India, that reflected gender representation and hiring trends, workplace policies and support systems.
The Challenge
As we got into the content, the scale and sensitivity of the work was evident.
We were working with large volumes of data that reflected systemic gaps in gender equality across industries. These were not just numbers. They pointed to deeper structural issues in how workplaces are designed and experienced by women. Each scorecard and factsheet pointed details about a specific sector and company. They had to look cohesive as well.
Through discussions with the Udaiti team, we aligned on a key challenge. How do we present this data in a way that is clear and actionable for corporate stakeholders, while still retaining the gravity of the issue?
The information needed to be precise and credible, but also engaging enough to drive reflection and change.
Our Approach
We approached this as a data-led editorial design system.
We began by immersing ourselves in the research, understanding not just data, but the stories and implications behind it. This helped us move beyond representation of information to interpretation.
We chose to keep the design clean, structured and purposeful. The idea was to let the data lead, while building a system that could guide the reader through it intuitively.
Every decision came back to one question. How can we make this information easier to understand and harder to ignore?
The Process
We started by building a consistent editorial framework that could scale across multiple scorecards and factsheets.


Hierarchy became the backbone of the system. We designed layouts that clearly separated insights, data points and supporting information, making it easier for readers to scan and absorb key takeaways.
Complex datasets were translated into clear, structured visualizations. Charts, graphs and infographics were designed not just for clarity, but for emphasis highlighting gaps, comparisons and trends that matter in corporate contexts.
We developed a cohesive iconography system to support quick comprehension and create visual anchors across documents. These icons acted as small narrative cues, helping break down dense information into digestible parts.
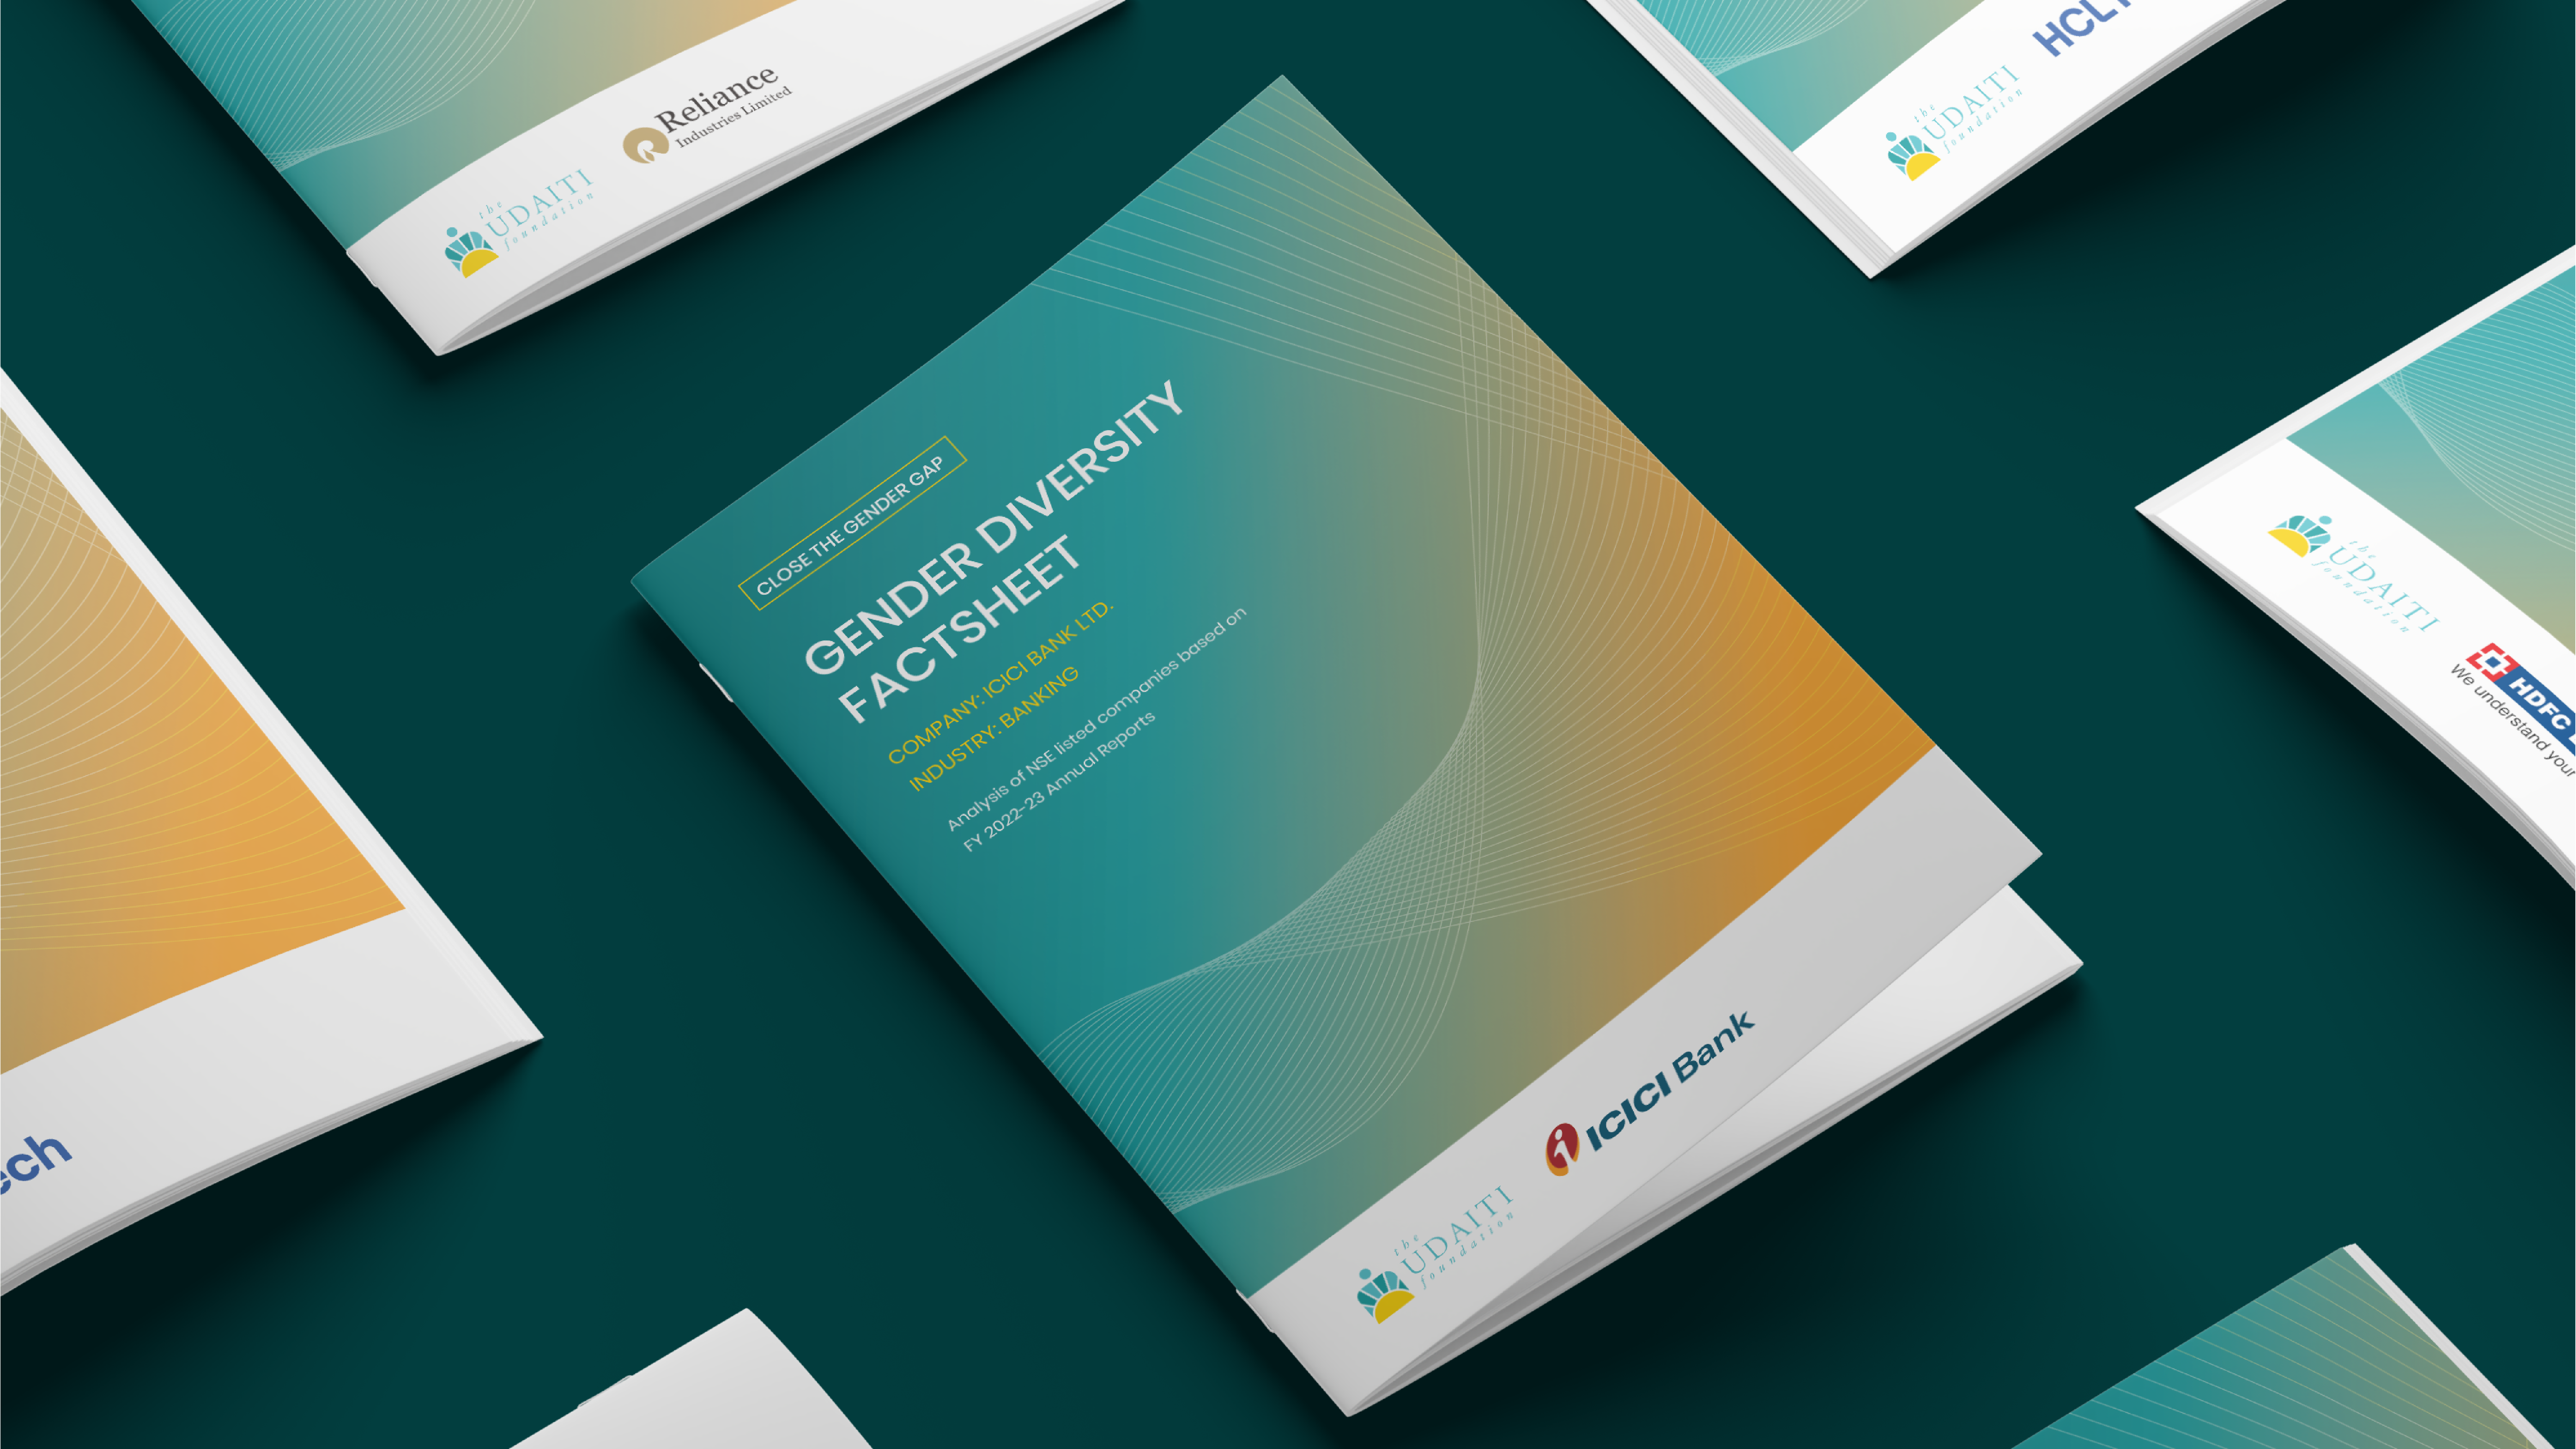

The visual language was kept minimal yet intentional. Subtle design elements and a restrained color palette ensured the documents felt professional and credible, while still approachable for a wide range of stakeholders.
At every stage, we worked closely with Udaiti’s team, refining content and structure to ensure accuracy and alignment with their larger mission.
Impact
The outcome is a suite of editorial tools designed to drive awareness and action.
Udaiti Foundation’s scorecards and factsheets make it easier for corporate leaders, policymakers and stakeholders to understand where they stand on gender equality, and where change is needed.
The design brings clarity to complexity, allowing critical insights to surface quickly while maintaining depth for those who want to engage further.
More importantly, it helps shift the conversation. From passive reporting to active reflection.
For us, this project was about more than data design. It was about making systemic gaps visible, and using design to support more informed, equitable decision-making.
The Brief
Some projects feel less like assignments and more like shared intent.
When Udaiti Foundation approached us, we knew this was one of them. As a not-for-profit focused on advancing women’s economic participation in India, their work sits at the intersection of research, policy and real-world impact.
The ask was to design a comprehensive set of scorecards and factsheets focused on data about gender equality in employment. These would capture critical data across corporate sectors in India, that reflected gender representation and hiring trends, workplace policies and support systems.
The Challenge
As we got into the content, the scale and sensitivity of the work was evident.
We were working with large volumes of data that reflected systemic gaps in gender equality across industries. These were not just numbers. They pointed to deeper structural issues in how workplaces are designed and experienced by women. Each scorecard and factsheet pointed details about a specific sector and company. They had to look cohesive as well.
Through discussions with the Udaiti team, we aligned on a key challenge. How do we present this data in a way that is clear and actionable for corporate stakeholders, while still retaining the gravity of the issue?
The information needed to be precise and credible, but also engaging enough to drive reflection and change.
Our Approach
We approached this as a data-led editorial design system.
We began by immersing ourselves in the research, understanding not just data, but the stories and implications behind it. This helped us move beyond representation of information to interpretation.
We chose to keep the design clean, structured and purposeful. The idea was to let the data lead, while building a system that could guide the reader through it intuitively.
Every decision came back to one question. How can we make this information easier to understand and harder to ignore?
The Process
We started by building a consistent editorial framework that could scale across multiple scorecards and factsheets.
Hierarchy became the backbone of the system. We designed layouts that clearly separated insights, data points and supporting information, making it easier for readers to scan and absorb key takeaways.
Complex datasets were translated into clear, structured visualizations. Charts, graphs and infographics were designed not just for clarity, but for emphasis highlighting gaps, comparisons and trends that matter in corporate contexts.
We developed a cohesive iconography system to support quick comprehension and create visual anchors across documents. These icons acted as small narrative cues, helping break down dense information into digestible parts.
The visual language was kept minimal yet intentional. Subtle design elements and a restrained color palette ensured the documents felt professional and credible, while still approachable for a wide range of stakeholders.
At every stage, we worked closely with Udaiti’s team, refining content and structure to ensure accuracy and alignment with their larger mission.
Impact
The outcome is a suite of editorial tools designed to drive awareness and action.
Udaiti Foundation’s scorecards and factsheets make it easier for corporate leaders, policymakers and stakeholders to understand where they stand on gender equality, and where change is needed.
The design brings clarity to complexity, allowing critical insights to surface quickly while maintaining depth for those who want to engage further.
More importantly, it helps shift the conversation. From passive reporting to active reflection.
For us, this project was about more than data design. It was about making systemic gaps visible, and using design to support more informed, equitable decision-making.


More Projects
More Projects
More Projects



Contact us
We love working with businesses of all shapes and sizes.
or write to us at enquire@manasidoshi.com



Contact us
We love working with businesses of all shapes and sizes.
or write to us at enquire@manasidoshi.com
Contact us
We love working with businesses of all shapes and sizes.
or write to us at enquire@manasidoshi.com